Japanese Candlesticks Analysis 18.09.2012 (EUR/USD, USD/JPY)
18.09.2012 / 11:27
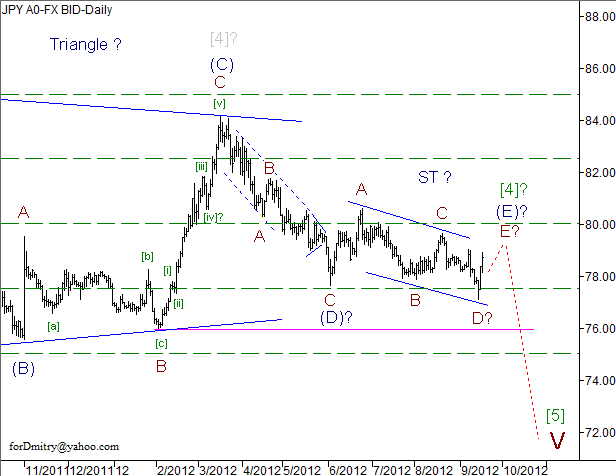
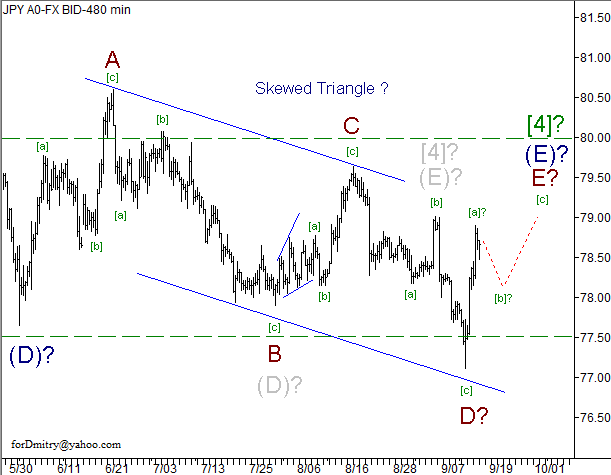
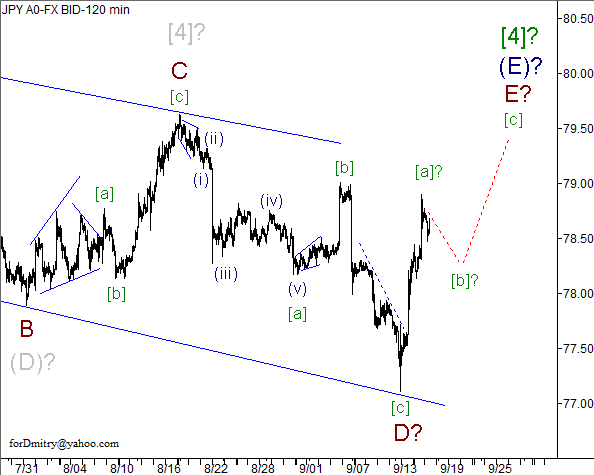
Analysis for September 18th, 2012
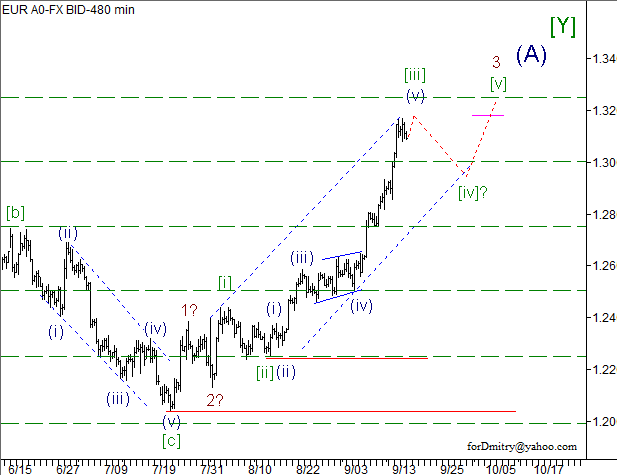
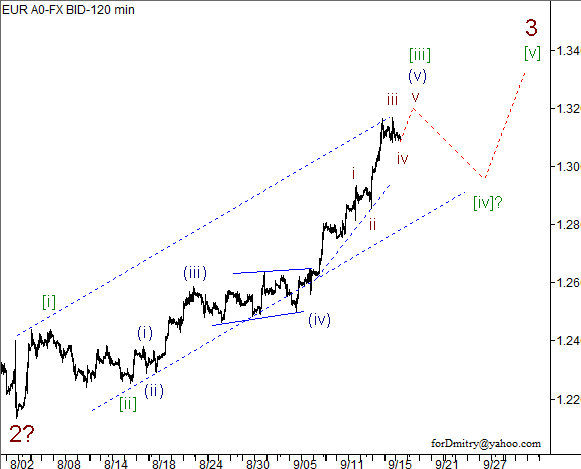
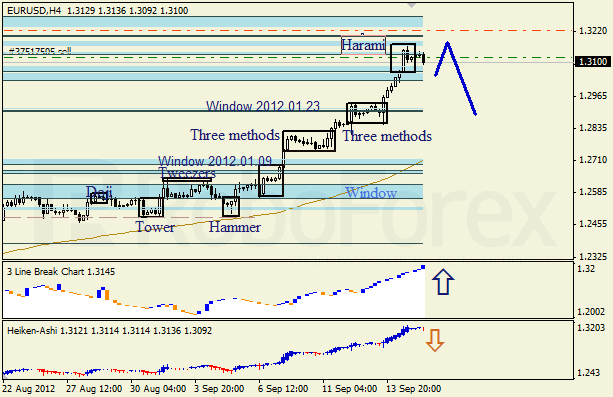
EUR/USD
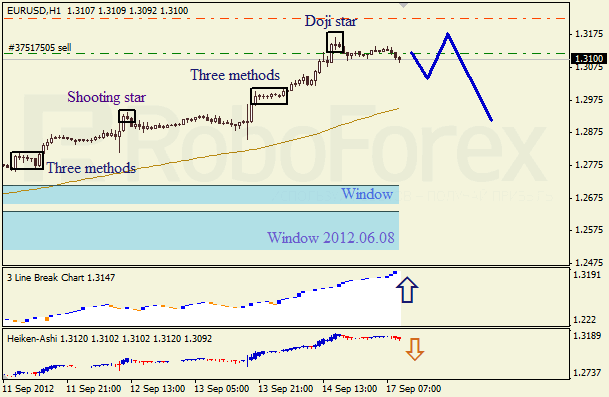
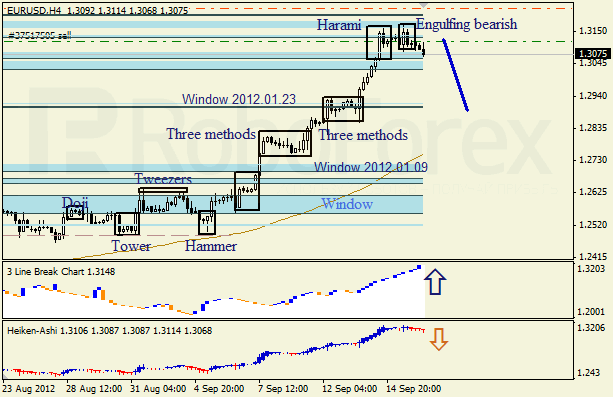
The H4 chart of the EUR/USD currency pair shows the start of a correction on the ascending trend. Three Line Break chart indicates the current trend; Harami and Engulfing Bearish patterns, and Heiken Ashi candlesticks confirm the correction. The closest Window is a resistance level.
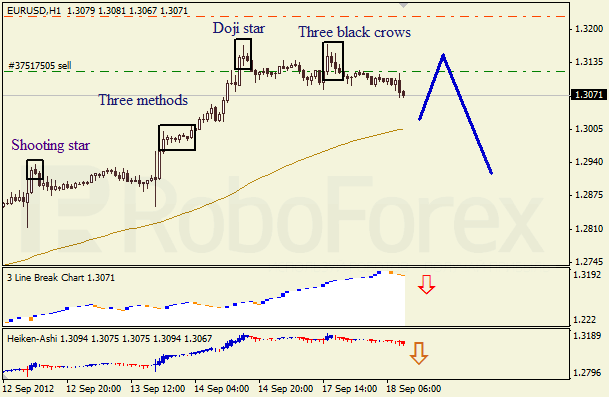
The H1 chart of the EUR/USD currency pair also shows a correction on the ascending trend. Doji Star and Three Black Crows patterns, as well as Three Line Break chart and Heiken Ashi candlesticks, confirm a descending movement.
USD/JPY
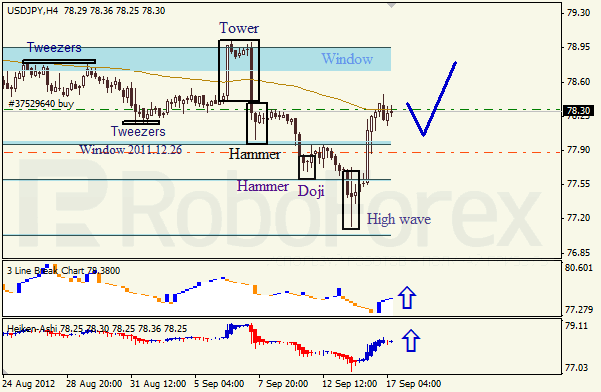
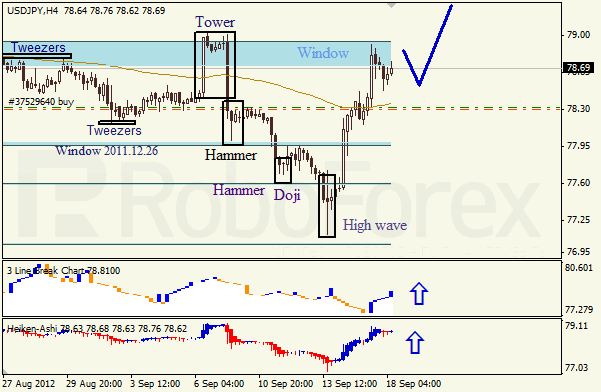
The H4 chart of the USD/JPY currency pair shows a bullish tendency and a trend change. The closest Window is a resistance level. Three Line Break chart and Heiken Ashi candlesticks confirm an ascending movement.
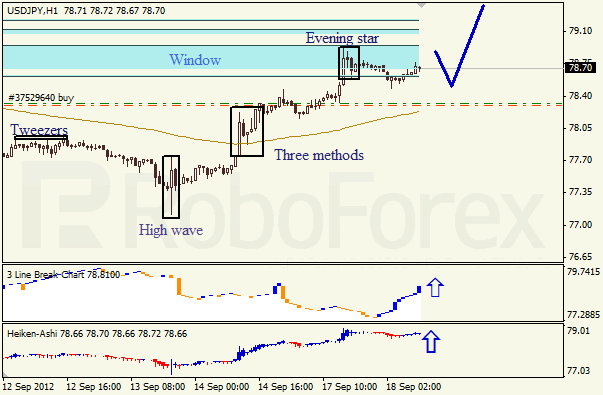
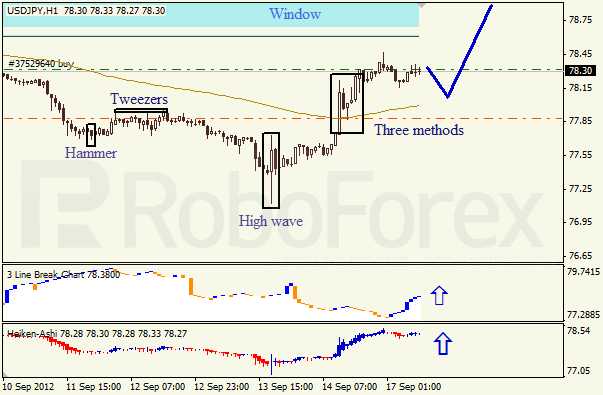
The H1 chart of the USD/JPY currency pair shows a bullish tendency on the ascending trend and a weak Evening Star pattern (which has yet to be confirmed). Three Line Break chart and Heiken Ashi candlesticks indicate an ascending movement.