الجمعة، 31 أغسطس 2012

USD Gains as Consumer Sentiment Rose to Three-Month High in Augus


THE TAKEAWAY: [U.S. consumer confidence rose in August to highest level in three months] > [Adds to signs of improving U.S. economy] > [USD strengthens]
Consumer confidence in the U.S. rose more than expected in August to the highest level in three months, adding to signs that the U.S. economy is picking up. Final monthly readings indicated that the Thomson Reuters / University of Michigan Confidence Index (MCSI) climbed to 74.3 in August from its preliminary print of 73.6 and July’s reading of 72.3. The median forecast of 60 economists surveyed by Bloomberg News called for a final print of 73.6.
Recent economic data has shown improvements in job growth and home prices, boosting consumer sentiment and the likelihood of a pickup in household spending in coming months. On the other hand, rising fuel prices and concerns over impending tax changes may be holding back larger gains in consumer confidence.
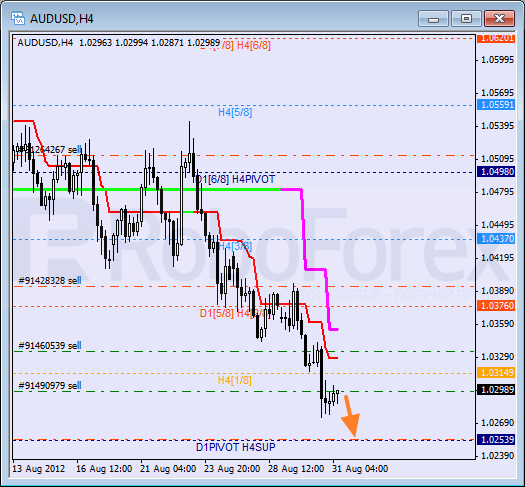
AUDUSD 1-minute Chart: August 31, 2012
USD_Gains_as_Consumer_Sentiment_Rose_to_Three-Month_High_in_August__body_Picture_2.png, USD Gains as Consumer Sentiment Rose to Three-Month High in August
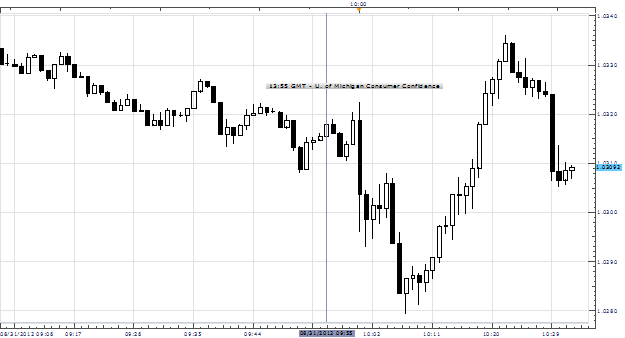
Chart created using Market Scope – Prepared by Tzu-Wen Chen
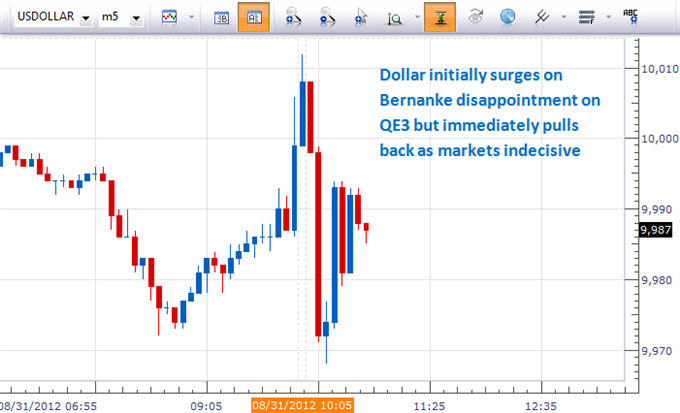
In the minutes following data release, the U.S. dollar strengthened against the Australian dollar, rising to a high of $1.0279. The subsequent reversal came after Federal Reserve Chairman Ben Bernanke’s comments on the U.S. economic outlook, ahead of today’s Jackson Hole Economic Policy Policy Symposium.
Summer Sale - Bikinis - Swimwear - Beachwear

Dollar Higher on Jackson Hole Speech as Bernanke Disappoints on QE3


Fed Chairman Ben Bernanke sent the US Dollar (ticker: USDOLLAR) sharply higher and the US S&P 500 notably lower as he failed to provide clear indication that the Fed would institute the next wave of Quantitative Easing (QE3).
Bernanke critically said that the central bank “wouldn’t rule out further asset purchases” as stagnation in the US labor market remains a “grave concern”. Yet his words added little to recent Fed rhetoric which made clear that officials kept all options on the table—including further asset purchases.
US Dollar Surges as Bernanke Fails to Announce QE3, Dow Jones FXCM Dollar Index Sharply Higher
us_dollar_higher_on_jackson_hole_qe3_disappointment_body_Picture_5.png, Dollar Higher on Jackson Hole Speech as Bernanke Disappoints on QE3
Thus the US Federal Reserve remains in “wait and see” mode as it keeps an especially close eye on domestic economic data. Bernanke himself said that the impact of Quantitative Easing has been “economically meaningful” as it helped drive long-term Treasury Bond yields significantly and added to a sustained recovery in US stock markets.
Yet ultimately the Fed’s moves have been far short of a panacea as the Fed Chairman highlighted labor market improvement as “painfully slow” and high unemployment could potentially “wreak structural damage” to the world’s largest economy.
The month of September looms large as a highly-anticipated US Nonfarm Payrolls report will shed further light on the state of the domestic labor market. Given the Fed’s clear focus on job creation, any significant disappointment in August Nonfarm Payrolls data could send the US Dollar sharply lower on expectations of further Federal Reserve Quantitative Easing.
Markets were on pins and needles ahead of Fed Chairman Ben Bernanke’s address as any surprises could force substantial swings across global financial markets. Bernanke famously used his 2010 speech at Jackson Hole to telegraph the Fed’s intention to institute the second wave of Quantitative Easing (QE2), and more recent Fed rhetoric suggested history could repeat itself with talk of QE3.
US Treasury Bonds traded sharply higher in the days ahead of Jackson Hole on the potential for further Quantitative Easing. Indeed, the 10-year Treasury Yield fell sharply off of a critical price ceiling at its 200-day Simple Moving Average—leaving the US Dollar itself at a critical juncture.
us_dollar_higher_on_jackson_hole_qe3_disappointment_body_Picture_6.png, Dollar Higher on Jackson Hole Speech as Bernanke Disappoints on QE3
The next moves in the US Dollar could ultimately decide its trend through the rest of 2012 and set the tone for Greenback tracking into 2013.

Forex Technical Analysis 2012/03/09 (EUR/USD, GBP/USD, USD/CHF, AUD/USD, NZD/USD) Forecast FX


Forex Trading Machine

Veteran trader Reveals How to Generate a 5 Figure income Trading

the Forex Market with a Revolutionary and Unique Strategy

EUR/USD


The EUR/USD currency pair continues moving inside the ascending channel, the price has broken “triangle” pattern upwards. The pair is expected to continue growing up, the target of the growth is the area of 1.2650. One can consider buying Euro near the level of 1.2575. If the price falls down lower than 1.2485, this scenario will be cancelled.


GBP/USD


The GBP/USD currency pair is moving inside the ascending channel, the price is expected to continue growing up. The test of the ascending trendline at the RSI at the daily chart is a signal to buy Pound. There is a strong support level in the area of 1.5760. The closest target of the growth is the area of 1.5960, one can consider buying the pair from the current levels.


USD/CHF


The USD/CHF currency pair continues moving inside the descending channel. The price has broken the support level in the area of 0.9555 and is expected to continue falling down. The target of the fall is the area of 0.9495. One can consider selling Franc from the current levels with the stop above 0.9580.


AUD/USD


Australian Dollar has tested the ascending channel’s lower border and currently the price continues growing up. The closest target of the growth is the area of 1.0455. One can consider buying the pair with the tight stop. If the price falls down lower than 1.0280, this scenario will be cancelled.


NZD/USD


New Zealand Dollar continues moving inside the ascending channel. The price has rebounded from the channel’s lower border, we should expect it to start growing up. The closest target of the growth is the area of 0.8215. The test of the ascending trendline at the RSI is an additional signal of the growth. If the price falls down lower than 0.7960, this scenario will be cancelled.

Wave Analysis 31.08.2012 (NZD/USD, EUR/USD)


NZD/USD


New Zealand Dollar continues forming wave (3). I’ve already moved the stop on sell order opened yesterday into the black. In the near term, we can expect the pair to continue falling down. The short‑term target for the bears is at the level of 0.7800.


As we can see at the H1 chart, the price is moving downwards and forming wave 3. Earlier wave (2) was finished in the form of zigzag pattern. During Friday we can expect the price to continue falling down and break the local minimum.


EUR/USD


At the H4 chart the price continues forming double zigzag pattern inside wave [4]. On the minor wave level Euro is forming wave C. There is a possibility that in the nearest future the price may grow up and break the local maximum.


As we can see at the H1 chart, Euro has finished wave [2]. We can expect the price to start moving upwards inside wave [3] of C during the day. The market may reach the level of 1.2650 within the next several days, but later Euro will most probably make a reverse in a downward direction.

Murray Math Lines 31.08.2012 (AUD/USD, GBP/CHF, EUR/GBP)

Forex Trading Machine


AUD/USD


Australian Dollar is still falling down. We can expect the price to continue moving downwards during Friday, the main target remains at the 0/8 level. Later this level may become a starting point of the correction.


At the H1 chart the local correction is taking place, the bears are supported by the Super Trend’s line. If the price rebounds from the current levels, the pair will continue falling down towards the 0/8 one.


BeachFashionShop.com - Bikinis - Beachwear


GBP/CHF


At the H4 chart the GBP/CHF currency pair is still being corrected. We can’t exclude a possibility that the bears may try to enter an “oversold zone” on Friday. Later the price may continue falling down up to the -2/8level.


The bears were supported by the 2/8 level and the pair started falling down again. Now they have to keep the price below the Super Trends’ lines. Most likely, the pair will break the -2/8 level within the next several days and the lines at the chart will be redrawn.

F-Secure Internet Security 2012

EUR/GBP


The bulls were supported by the 3/8 level twice, yesterday the price rebounded from it once again. If the bears are able to keep the price above the H4 Super Trend’s line, the pair will continue growing up. The closest target is the 7/8 level.


At the H1 chart the price movement is supported by the 6/8 level, thus indicating that the pair may start growing up again. The bears may enter an “overbought zone” during the day. If the price breaks the +2/8level, the lines at the chart will be redrawn.


Ichimoku Cloud Analysis 31.08.2012 (GBP/USD, GOLD)


"Learn to profit consistently and systematically trading the
 Forex market with my 3 top PDFT (Price Driven Forex Trading) systems."


GBP/USD


GBPUSD, Time Frame H4 – Indicator signals: Tenkan-Sen and Kijun-Sen intersected above Kumo Cloud and formed “Golden Cross” (1), the lines are very close to each other and both are horizontal. Ichimoku Cloud is going up (2), Senkou Spans A and B are also horizontal. Chinkou Lagging Span is below the chart, the price is inside Kumo Cloud. Short‑term forecast: we can expect resistance of Senkou Span A and the price to move downwards. Sell Limit and Stop Loss are placed above Kumo Cloud.


GBPUSD, Time Frame Н1 – Indicator signals: Tenkan-Sen and Kijun-Sen intersected inside Kumo Cloud and formed “Dead Cross” (1), Tenkan-Sen is directed upwards, and Kijun-Sen is horizontal. Ichimoku Cloud is going down (2), Senkou Span A is moving upwards, and Senkou Span B is also horizontal. Chinkou Lagging Span is below the chart, the price is in the channel between Tenkan-Sen and Kijun-Sen. Short‑term forecast: we can expect resistance of Senkou Span B and Kijun-Sen, and the price to fall down.


GOLD


GOLD, Time Frame H4 – Indicator signals: Tenkan-Sen and Kijun-Sen intersected above Kumo Cloud and formed “Dead Cross” (1), both lines are horizontal. Ichimoku Cloud is going up (2), Senkou Spans A and B are also horizontal. Chinkou Lagging Span is below the chart. Short‑term forecast: we can expect resistance of Kijun-Sen and the price to move inside Kumo Cloud.


GOLD, Time Frame Н1 – Indicator signals: Tenkan-Sen and Kijun-Sen intersected below Kumo Cloud and formed “Dead Cross” (1), both lines are horizontal. Ichimoku Cloud is going down (2), Senkou Span A is horizontal, and Senkou Span B is directed downwards. Chinkou Lagging Span is on the chart, the price is in on Senkou Span A. Short‑term forecast: we can expect resistance of Senkou Span B and the price to move downwards.


Japanese Candlesticks Analysis 31.08.2012 (EUR/USD, USD/JPY)

Forex Megadroid Robot


EUR/USD


The H4 chart of the EUR/USD currency pair shows a correction on the ascending trend. The closest Window is a resistance level. Three Line Break chart confirms the current trend, Heiken Ashi candlesticks indicate the correction.


The H1 chart of the EUR/USD currency pair shows a sideways tendency. Shooting Star pattern, Three Line Break chart, and Heiken Ashi candlesticks confirm a descending movement.


BeachFashionShop.com - Bikinis - Beachwear


USD/JPY


The H4 chart of the USD/JPY currency pair shows a sideways tendency. The closest Window is a resistance level. Three Line Break chart, Tweezers pattern, and Heiken Ashi candlesticks confirm a descending movement.


The H1 chart of the USD/JPY currency pair shows a bearish tendency on the descending trend, which is indicated by Engulfing Bearish pattern. Three Line Break chart and Heiken Ashi candlesticks confirm a descending movement.
F-Secure Internet Security 2012

الخميس، 30 أغسطس 2012

Forex Technical Analysis 2012/31/08 USD/CHF AUD/USD NZD/USD


USD/CHF


The USD/CHF currency pair continues moving according to the forecast, the target of the fall is the area of 0.9495. One can consider selling the pair aggressively from the current levels with the stop above 0.9615 and increase the amount of short positions after the price breaks the level of 0.9540. The test of the descending trendline at the RSI is an additional signal to sell Franc.


AUD/USD


Despite our expectations Australian Dollar is still moving downwards. The RSI indicator was supported by the ascending trendline. There is a strong support level in the area of 1.0310. One can consider buying the pair aggressively with the tight stop. If the price falls down lower than 1.0280, this scenario will be cancelled.


NZD/USD


New Zealand Dollar continues moving inside the ascending channel. Currently the price is testing the channel’s lower border, we should expect it to rebound and start growing up. One can still consider buying the pair with the tight stop. If the price falls down lower than 0.7970, this scenario will be cancelled. The test of the ascending trendline at the RSI is an additional signal to buy the pair.

Forex Technical Analysis 2012/31/08 EUR/USD GBP/USD


EUR/USD


The EUR/USD currency pair continues moving inside the ascending trend, the price hasn’t been able to break the resistance level in the area of 1.2575. Right now Euro is very close to the channel’s lower border, we should expect it to rebound and start moving upwards. One can consider buying the pair with the tight stop. The target of the growth is the area of 1.2650. We recommend to increase the amount of long positions only after the price breaks the level of 1.2575. If the price falls down lower than 1.25, this scenario will be cancelled.


Download and Try Rinse for FREE


GBP/USD


The GBP/USD currency pair is moving inside the ascending channel, at the moment the price is testing the resistance level in the area of 1.5850. One can consider buying Pound with the tight stop. The target of the growth is the area of 1.5960. If the price falls down lower than 1.5790, this scenario will be cancelled.

Wave Analysis 30.08.2012 EUR/USD


EUR/USD


At the H4 chart the price continues the corrective movement in an upward direction. We may assume that wave [4] is taking the form of double zigzag pattern. Most likely, in the nearest future Euro will grow up and form wave C of (Y). However, later we can expect the price to make a reverse.


As we can see at the H1 chart, Euro is in the very beginning of wave [3] of C. We can’t exclude a possibility that the price may break the local maximum during the day. The short-term target is at the level of 1.2650.

Download RealPlayer for FREE

Wave Analysis 30.08.2012 NZD/USD


NZD/USD


It looks like New Zealand Dollar is moving downwards inside wave (3). Earlier the price completed wave 2 in the form of zigzag pattern. In the future we can expect the pair to continue falling down. The short‑term target is at the level of 0.7800.


More detailed wave structure is shown on the H1 chart. The price is moving downwards and forming a descending wave (3) with the third wave inside it. Most likely, the price will continue falling down during the day.