Forex Megadroid Robot


EUR/USD
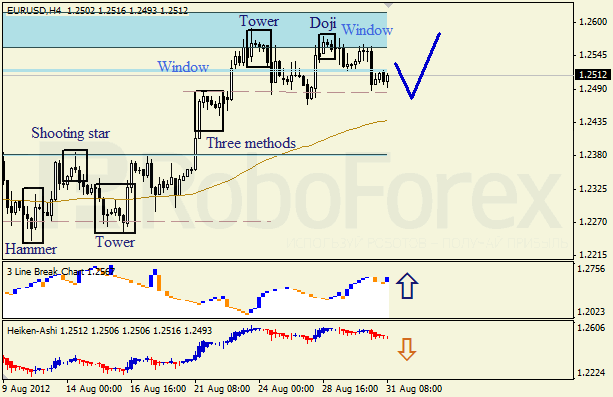
The H4 chart of the EUR/USD currency pair shows a correction on the ascending trend. The closest Window is a resistance level. Three Line Break chart confirms the current trend, Heiken Ashi candlesticks indicate the correction.

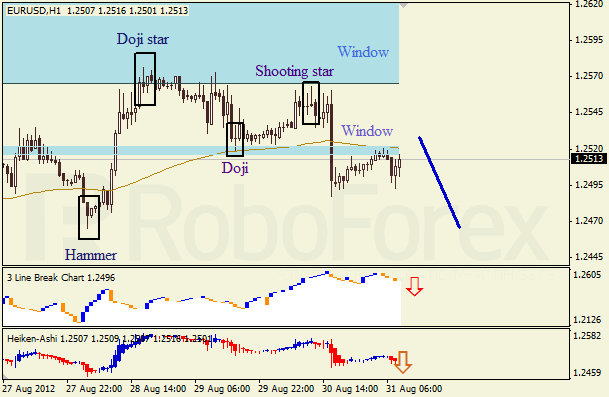
The H1 chart of the EUR/USD currency pair shows a sideways tendency. Shooting Star pattern, Three Line Break chart, and Heiken Ashi candlesticks confirm a descending movement.

USD/JPY
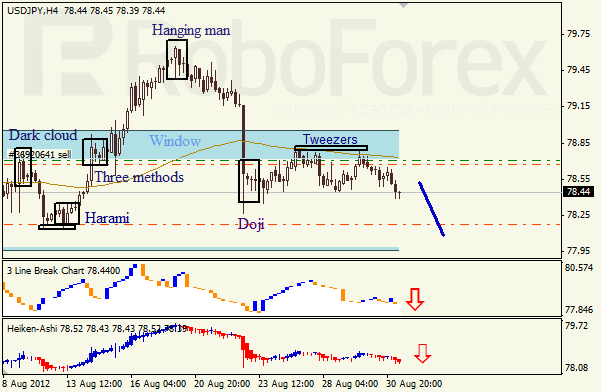
The H4 chart of the USD/JPY currency pair shows a sideways tendency. The closest Window is a resistance level. Three Line Break chart, Tweezers pattern, and Heiken Ashi candlesticks confirm a descending movement.

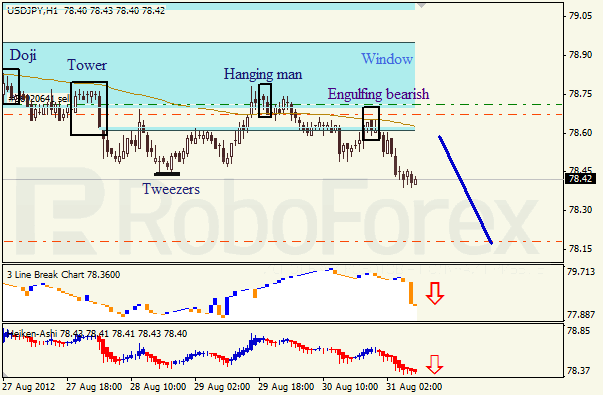
The H1 chart of the USD/JPY currency pair shows a bearish tendency on the descending trend, which is indicated by Engulfing Bearish pattern. Three Line Break chart and Heiken Ashi candlesticks confirm a descending movement.

ليست هناك تعليقات:
إرسال تعليق